I am building a pixel platformer demo to learn RL using Puffer. In order to train my pixel platformer (pretty much daily), the RL training must be very fast (on a commodity HW - and I have a 2080RTX).
Puffer 3.0 is already pretty fast for most simple envs, but for a pixel platformer env, there were several choke-points. So I went on a long journey to add full multi-threading / GPU batching and ended up rewriting the entire Puffer RL loop (eval+train) from Python to C++.
My private code/fork is here - I recommend waiting for Puffer 4.0 as Puffer is well-maintained and you can get additional (paid) support via PufferAI. I am not affiliated with Puffer; I am an OSS contributor who found Puffer super-useful to tinker with as a side-project.
Before we start, here is the top-level comparison between the previous Multiprocessing backend (2 procs) and my new native multithreading backened (using 8 CUDA threads/12 env threads) using the same number of envs/steps/etc:
| Game/Env | 2080 RTX | 4090 RTX | ||
|---|---|---|---|---|
| MultiProc | NativeMT | MultiProc | NativeMT | |
| go | 580K SPS | 1.8M SPS | 794K SPS | 1.8M SPS |
| breakout | 1.2M SPS | 4.5M SPS | 3.9M SPS | 6.1M SPS |
| pong | 1M SPS | 3M SPS | 3.2M SPS | 6.2M SPS |
Overview of RL / Puffer
Each iteration of the Puffer RL loop does evaluate first followed by train. train generates the neural network parameters for the evaluate to run the envs with.
The core eval loop looks like this:

Each eval iteration collects a horizon of H BPTT (back-prop through time) segments. Typically H is a nice power-of-2 number like 64. Each horizon’s segments runs through this forward->actions->logits->run_envs loops sequentially. Each segment runs/collects N environments’ observations/actions/rewards/terminals (a segment looks like this expanded out):

The forward pass in Puffer uses an LSTM network (typically 128x128 h/c configuration). For (multi)discrete envs such as `breakout`, the forward pass produces a `value` and `logits` the latter of which can be sampled from into `actions` fed into the envs.
The existing Puffer multiprocessing backend is a Python backend that (cleverly) used two Python processes to run (a) rollouts (b) GPU uploads in a double-buffered manner. The envs are/were written in C, the eval/training code is in Python/PyTorch (with a custom CUDA kernel for the PPO advantage function).
Overview of optimizations
-
Independent Multithreading for GPU batches and envs
-
Multi-threaded GPU Batches each with its own CUDA stream (depends on the GPU cores / GPU bandwidth) - batched segments within a horizon proceed sequentially in parallel to other batches.
-
Multi-threaded Env steps on the CPU.
-
-
Fused kernels with
outTensors- Fused kernels for sampling logit & value/decoder networks; internal libtorch functions for encoder/lstm.
-
Preallocated tensors
- Avoids CUDA caching allocator; no Tensor allocs during the forward pass.
-
Micro-optimizations pursuing Amdahl’s law
- Efficient use of threads to set things up, moving things into CPU/GPU as needed, and being careful with CUDA / CPU memory allocs.
Added Profiling Tools/Tests
- Added `scripts/test_cuda_perf.py` to test out bandwidth/FLOPs/launch kernel costs. Quick-n-dirty benchmarks when testing out on a vast.ai/runpod.io machine for comparison purposes. - Added `scripts/start_profile_env.sh` to profile multiple envs including the full/partial eval/train loop: - Profile just eval or eval+train with different `--vec.backend` etc CLI params. - (Optional) Outputs the CUDA profile (.json-> ui.perfetto.dev) along with useful stats into a text file.- Misc stuff
- Single threaded mode (non-multi-threaded version for debugging via
#define PUFFER_SINGLE_THREADED 1) - ‘cuda memcheck’ mode in C++ that outputs which of ‘our’ tensors are being cached by the CUDA caching allocator
#define PUFFER_CUDA_MEMCHECK 1 - Micro benchmarks (see
PerfTimer) + tensor comparisons inside the core C++ code to test stability and performance with realistic data/harness. - Timing etc wired up to the main python-side so the dashboard/profile all work seamlessly.
- Also added
GTesttests (outside of the repo as it uses CMAKE etc) to verify the core logic especially as I convert existing lstm/encoder -> new ops/GPU patterns.
- Single threaded mode (non-multi-threaded version for debugging via
Measure, Analyze, Optimize
Let’s dig into a PyTorch trace/profile to look for optimizations in the eval loop (train is a different kind of beast, we will explore that at a later date).
All profiles/notes are for puffer_breakout running on a machine with 4090 RTX.
Profiler notes
I added this script (in PufferLib/scripts) to profile envs with different backends/train/eval loops etc that also produces detailed timing info both from within the Py/C code as well as from CUDA.
bash scripts/profile_envs.sh puffer_breakout --profile.train 0 --profile.trace 1 --vec.backend Multiprocessing --profile.name multiprocessing
# Tip: You can provide multiple envs separated by comma e.g. puffer_breakout,puffer_go
This also uses the pytorch profiler to generate a .json file you can open with Perfetto - we will use this perfetto snapshots extensively to analyze performance (compute/bandwidth/memory).
First off, the multiprocessing backend looks like this under the profiler:
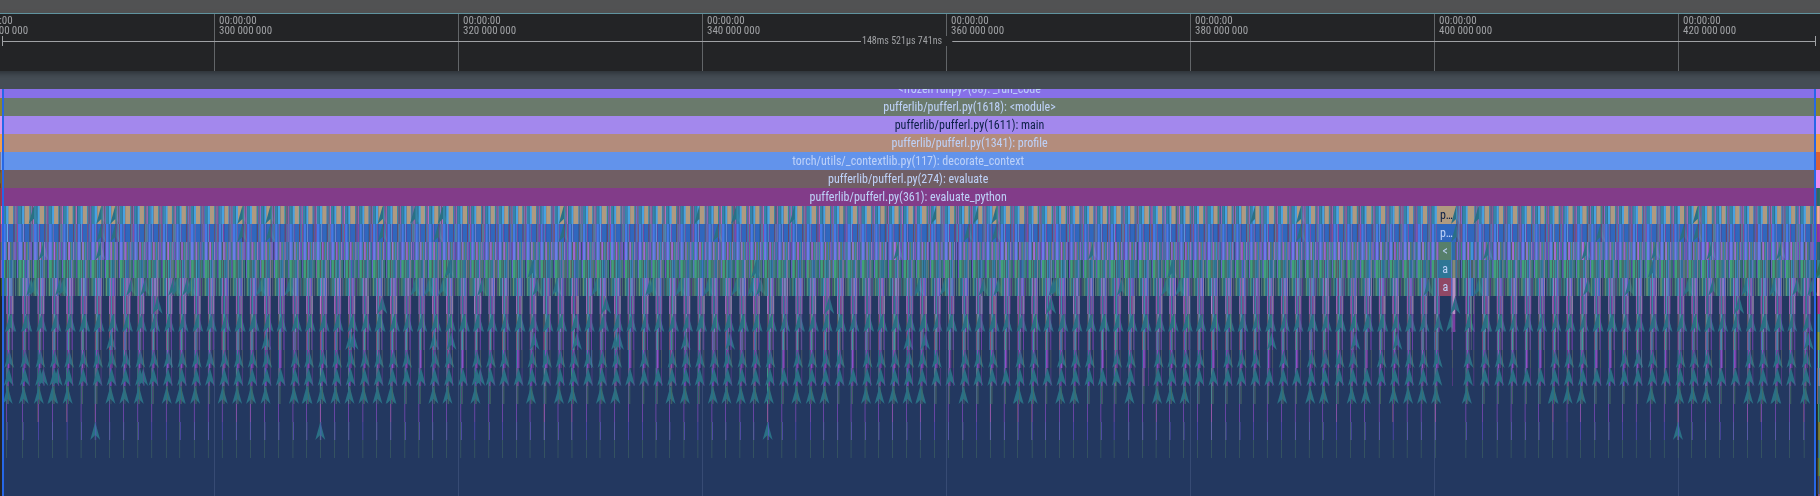
This shows the eval loop running two batches of 64 segments sequentially (forward pass+run_envs) taking a total of 143 ms on a 4090 RTX machine for the puffer_breakout env (~2.23ms per horizon for two batches of 4096 envs each / ~1.17ms per horizon per batch).
Let’s zoom in a bit into the forward+sample_logits parts to analyze the trace for (a) what takes the most time (b) where to optimize:
Here is the forward pass for a single segment (for a single batch with 4096 environments) (takes ~204us).
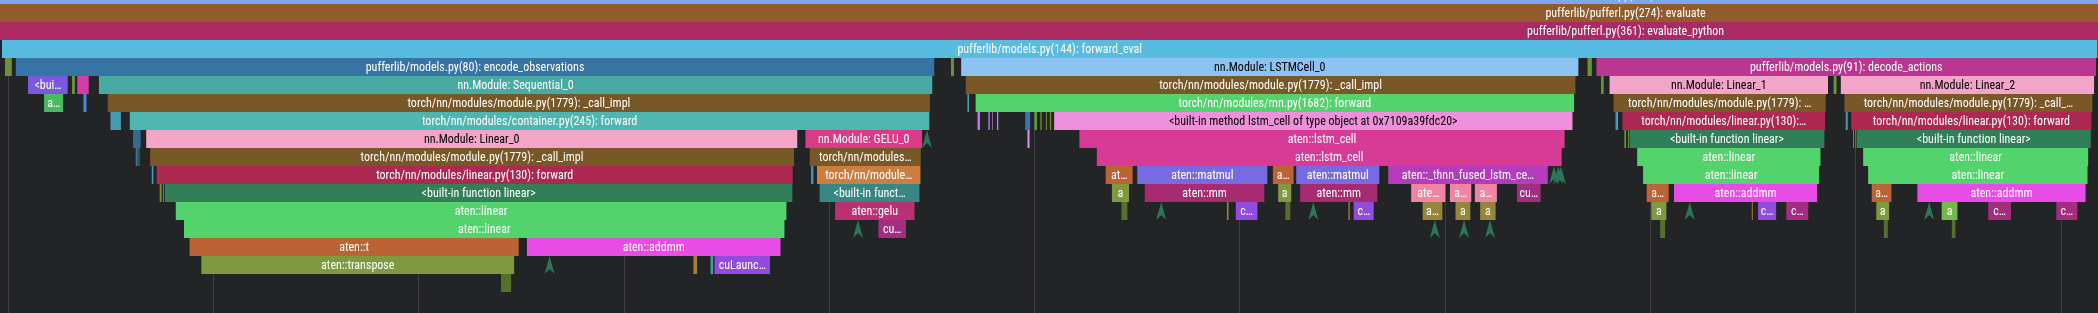
Here is the sample logits based on the output of the forward pass (takes ~304us)

As the environment generates obs, we have to transfer them to the GPU to run the forward pass with to generate logits/logprobs/values (takes ~196us).

Current tally: Eval full horizon takes ~143ms per eval loop iteration.
| Multiproc Eval breakdown for puffer_breakout on 4090RTX | Time | Notes |
|---|---|---|
| Copy Host-To-Device Obs/Rewards/Terminals | 217 us | ~195 us (obs) + ~22 us (rewards/terminals) |
| Encoder Obs -> Hidden | 64 us | |
| Forward LSTM hidden/h1/c1 -> h2/c2 | 60 us | h2/c2 for segment1 become h1/c1 for segment2 etc |
| Decoder/Value h2-> … ->Values/Logits | 46 us | |
| Sample Logits Logits->Logprobs/Actions | 344 us | |
| Run envs send actions->recv obs | ~460 us | |
| Total (per segment) | 1117 us | * 64 segments * 2 batches = 143ms per horizon |
We now have a good view of where the biggest time sinks are (follow Amdahl’s law). We can now pursue optimizations…
Optimization 1: Multi-threaded environments
Each horizon runs H segments sequentially. Each segment runs N environments. We can parallelize the N environments. (This is how I started this set of optimizations BTW - it snowballed into a nice Advent of Code-style puzzles.)
| Multiproc Eval | 143ms | 64 segments (2 batches of 4096 envs / batch) |
| Multithreaded Envs Envs are run in parallel | 79ms | 64 segments 1 batch 8192 total envs 12 threads |
~1.8x speedup |
This is simply spreading the load across the available cores. This code is in puffer_threads.h which uses one lock per batch of envs (each thread is alloted T/N envs where T is # of threads, N is # of envs). PufferOptions controls the number of threads T based on number of physical cores from the Python code.
Optimization 2: Multi-threaded GPU batching
Two of the major bottlenecks inside the segments are
- Transferring CPU (obs/rewards/terminals) -> GPU
- Running the forward pass once the data is in the GPU
One key insight is that while a horizon must run the segments sequentially, batches of horizons can be run in parallel.
We can parallelize the GPU batches (copy+ops) using the same multithreaded infra from the previous optimization. Each batch of B envs copies the obs/rewards/obs to the GPU; followed by running the forward pass/logit sampling; and then scheduling the B envs to be run using the prior multithreading independently.

We can parallelize via multithreading such that each batch runs in parallel with the others, while the segments within a batch run sequentially. (By sequentially, we follow the typical async/Promise model where .then()-like model schedules the next segment on any freely available thread/CPU core).
There are a few gotchas:
- By default, each thread gets its own CUDA stream (TLS-based). However, we want Batch B1 to not fight (
cudaSynchronize) with Batch B2 if they end up in the same thread.- Solution: Each batch gets its own CUDA stream regardless of which thread it ends up in (upto a max of 32 cuda streams)
- With multiple custom streams, the CUDA caching allocator will pool memory in a way where we will OOM frequently. This is either a bug or a
featureof the CUDA caching allocator.- Solution: Preallocate Tensors and avoid the PyTorch
CUDACachingAllocator(this is a big optimization in and of itself, we will dive deeper later). This also results in nice benefits as we conservecudaMemCpyAsyncandcudaStreamSynchronizecalls too. This is a much larger engineering effort though. - Tried/Not considered: You can play with PyTorch flags for CUDA caching allocator but you will hit a wall as the caching allocator does not work well with multithreaded CUDA streams as of this writing.
- Solution: Preallocate Tensors and avoid the PyTorch
After making this series of optimizations, we get the overall speedup:
| Multiproc Eval | 143ms | 64 segments (2 batches of 4096 envs / batch) |
| Multithreaded Envs Envs are run in parallel | 79ms | 64 segments 1 batch 8192 total envs 12 threads |
~1.8x speedup | ||
| Multithreaded batching GPU batching+Multithreaded Envs | 38ms | 64 segments 8 GPU batches on 8 batching (CPU) threads 8192 total envs (12 env CPU threads) |
~3.8x total speedup |
This also scales nicely: throw CPU cores/GPU cores/bandwidth (i.e. high-end nvidia chips like 5090RTX etc) at the problem, and the speedup scales.
To really see why this is the case, let’s look at the CUDA graphs of before / after.
With the existing backend (Multiprocessing) that uses serialized, single-thread GPU batching of copy/gpu ops, it looked like this:

…a single CPU thread managing a single CUDA stream with serialized copy+GPU ops.
Here is the new multi-threaded GPU batching that shows how the ~3.8x speedup was possible:
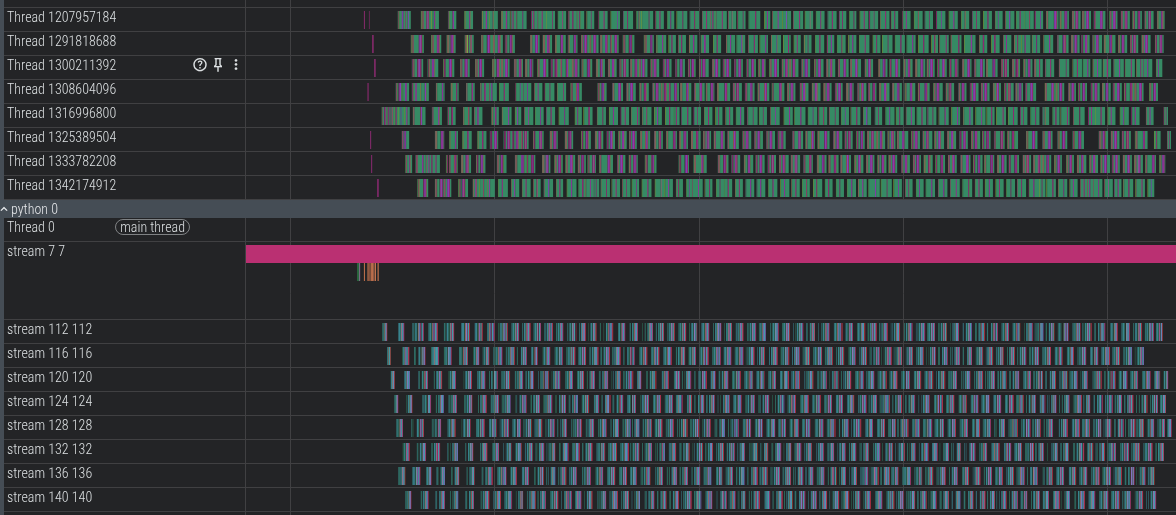
You can see the 8 GPU batches being scheduled by the 8 CPU threads. GPU copies (HToD/DToH) for a batch/segment can overlap with GPU ops for other batches/segments using 8 independent CUDA streams.
Let’s zoom in a bit:
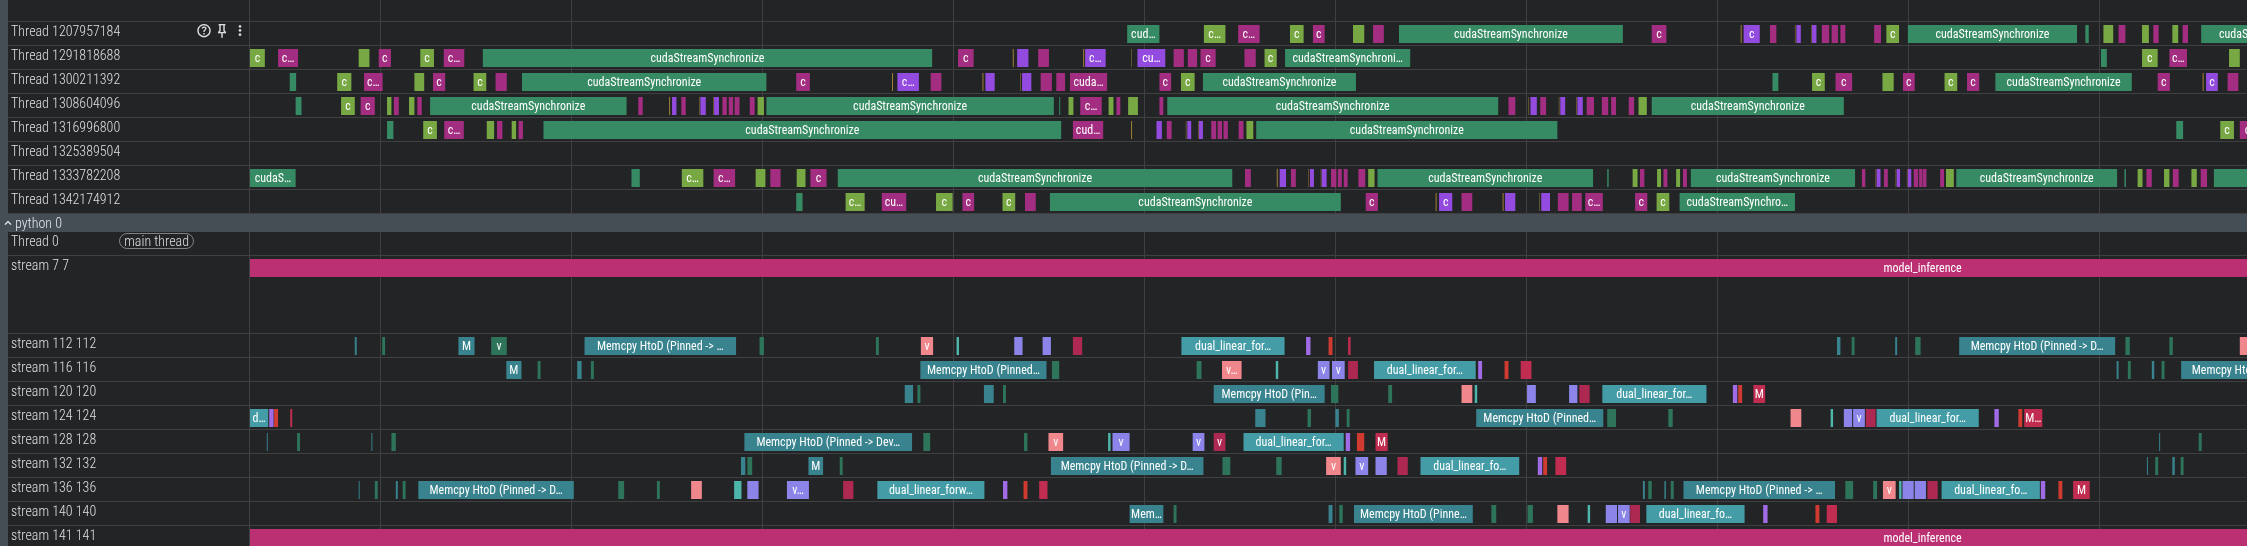
Note how the GPU ops for the first two threads are scheduled in parallel (as not all cores are being used by a single kernel). This also hides the cuda launch kernel latency.
NOTE: For chips such as nvidia 4090 RTX, there is only one GPU copy engine so the copies between segments themselves cannot overlap. GPU ops and copies do overlap. So if you look closely at this profile, there is at most one HostToDevice copy or DeviceToHost copy at any given time (HToD can overlap with DToH btw as PCIe is bidi).
(Note: all profiling done on the same 4090 RTX machine for puffer_breakout env with different backends; running -O3’ed C code).
GPU Batch size scaling effect
Here is the effect of scaling via different batch sizes and CPU thread counts:
4090 RTX breakout / 24 physical cores (*2 NUMA) 8192 envs
| | | | | | | | |
| # GPU Batches | # CPU Env threads | LSTM Forward (Eval) (ms) **(total per epoch) | Copy (Eval) (ms) **(total per epoch) | Env CPU (Eval) (ms) **(total per epoch) | SPS Eval+Train | Total wall-clock time(ms) / epoch Eval+Train | Notes |
|---|---|---|---|---|---|---|---|
| 1 | 8 | 2.3 ms | 28.8 ms | 81.6 ms | 3M SPS | 175 ms | Serial-like |
| 2 | 8 | 4 ms | 31.9 ms | 78.6 ms | 4.5M SPS | 116 ms | Multiproc-like |
| 4 | 8 | 11 ms | 54.4 ms | 74.5 ms | 5.6M SPS | 93 ms | |
| 8 | 8 | 36 ms | 101.9 ms | 63.2 ms | 6.1M SPS | 86 ms (Eval 34ms / Train 52ms) | Right batch/thread-count for PCI bw/env size |
| 12 | 8 | 30.5 ms | 120.8 ms | 75.5 ms | 6M SPS | 88 ms | Per-batch transfer size is too small |
| 8 | 1 | 12.2 ms | 39.5 ms | 94.6 ms | 3.7M SPS | 141 ms | Fixed batch-size Exp w/ CPU env threads |
| 8 | 2 | 13.9 ms | 42.1 ms | 84.3 ms | 5.2M SPS | 100 ms | |
| 8 | 4 | 15.3 ms | 63.3 ms | 65.3 ms | 5.9M SPS | 88 ms |
Note (**) Total time is across multiple threads. It’s meaningful to compare numbers within the same batch-size (LSTM/Copy) or same env-thread-size (Env CPU) but not across different batch/thread sizes. However, Total wall-clock time (ms) measures end-to-end time per eval+train epoch.
The (**) numbers are a bit deceptive: it looks like as we increase batch-size from 1->2->4, the LSTM forward takes 2.3 ms -> 4 ms -> 11 ms. However, batch size 1 = 8192 envs (scheduled from 1 CPU thread onto the GPU), batch size 2 = 4096 envs each, with 2 threads. By using 2 GPU threads, the total wall clock time reduces from 175ms -> 116ms (for total eval+train). While the per-batch numbers are useful to understand as we make targeted micro-optimizations (like using fused CUDA kernels), the wall-clock time is the real meaningful number when looking at things like multi-threaded GPU batching and so on. The CUDA profile in ui.perfetto.dev will also show how the threads overlap to ‘save’ time over the course of an epoch as these batches / segments in a horizon proceed independently from each other.
In the following sections, we will look at micro-optimizations as the overall optimizations are now setup.
(Micro-)Optimization 3: Use preallocated tensors with _out CUDA kernels
As I noted earlier, the CUDA caching allocator does not meet our needs especially when combined with multiple streams+multithreading. This constraint forces us to find creative solutions to manage memory. For reference, here is the core forward libtorch/PyTorch functions look like (from models.py):
# PyTorch Python code but this is wlog the same in C++ libtorch as well.
def forward_eval(self, observations, h1, c1):
  hidden = self.encoder(observations)
  h2, c2 = self.cell(hidden, (h1, c1))
  logits = self.decoder(h2)
  values = self.value(h2)
  return logits, values, h2, c2
Note how each function takes in a Tensor as input and outputs (creates) a new Tensor. In an ideal world, especially given how batches are shaped, the output tensors are used as intermediate tensors, thrown away (back to the cache, for later reuse) after this segment is done by the PyTorch allocator. However, with multiple CUDA streams + multiple threads the allocator maintains the Tensor memory for much longer.
I did a memory profile using this awesome tool.
Memory Profiler notes
# To use the PyTorch memory profiler, you must not use the CPU / GPU profiler and must ensure that the multithreading is off (set `-DPUFFER_SINGLE_THREADED=1` in `setup.py` or in the `puffer_threads.h`)
bash scripts/profile_envs.sh puffer_breakout --profile.train 0 --profile.trace 0 --profile.name memory_profile --profile.memory 1
Here is the memory profile when using the default CUDA caching allocator with multiple streams:
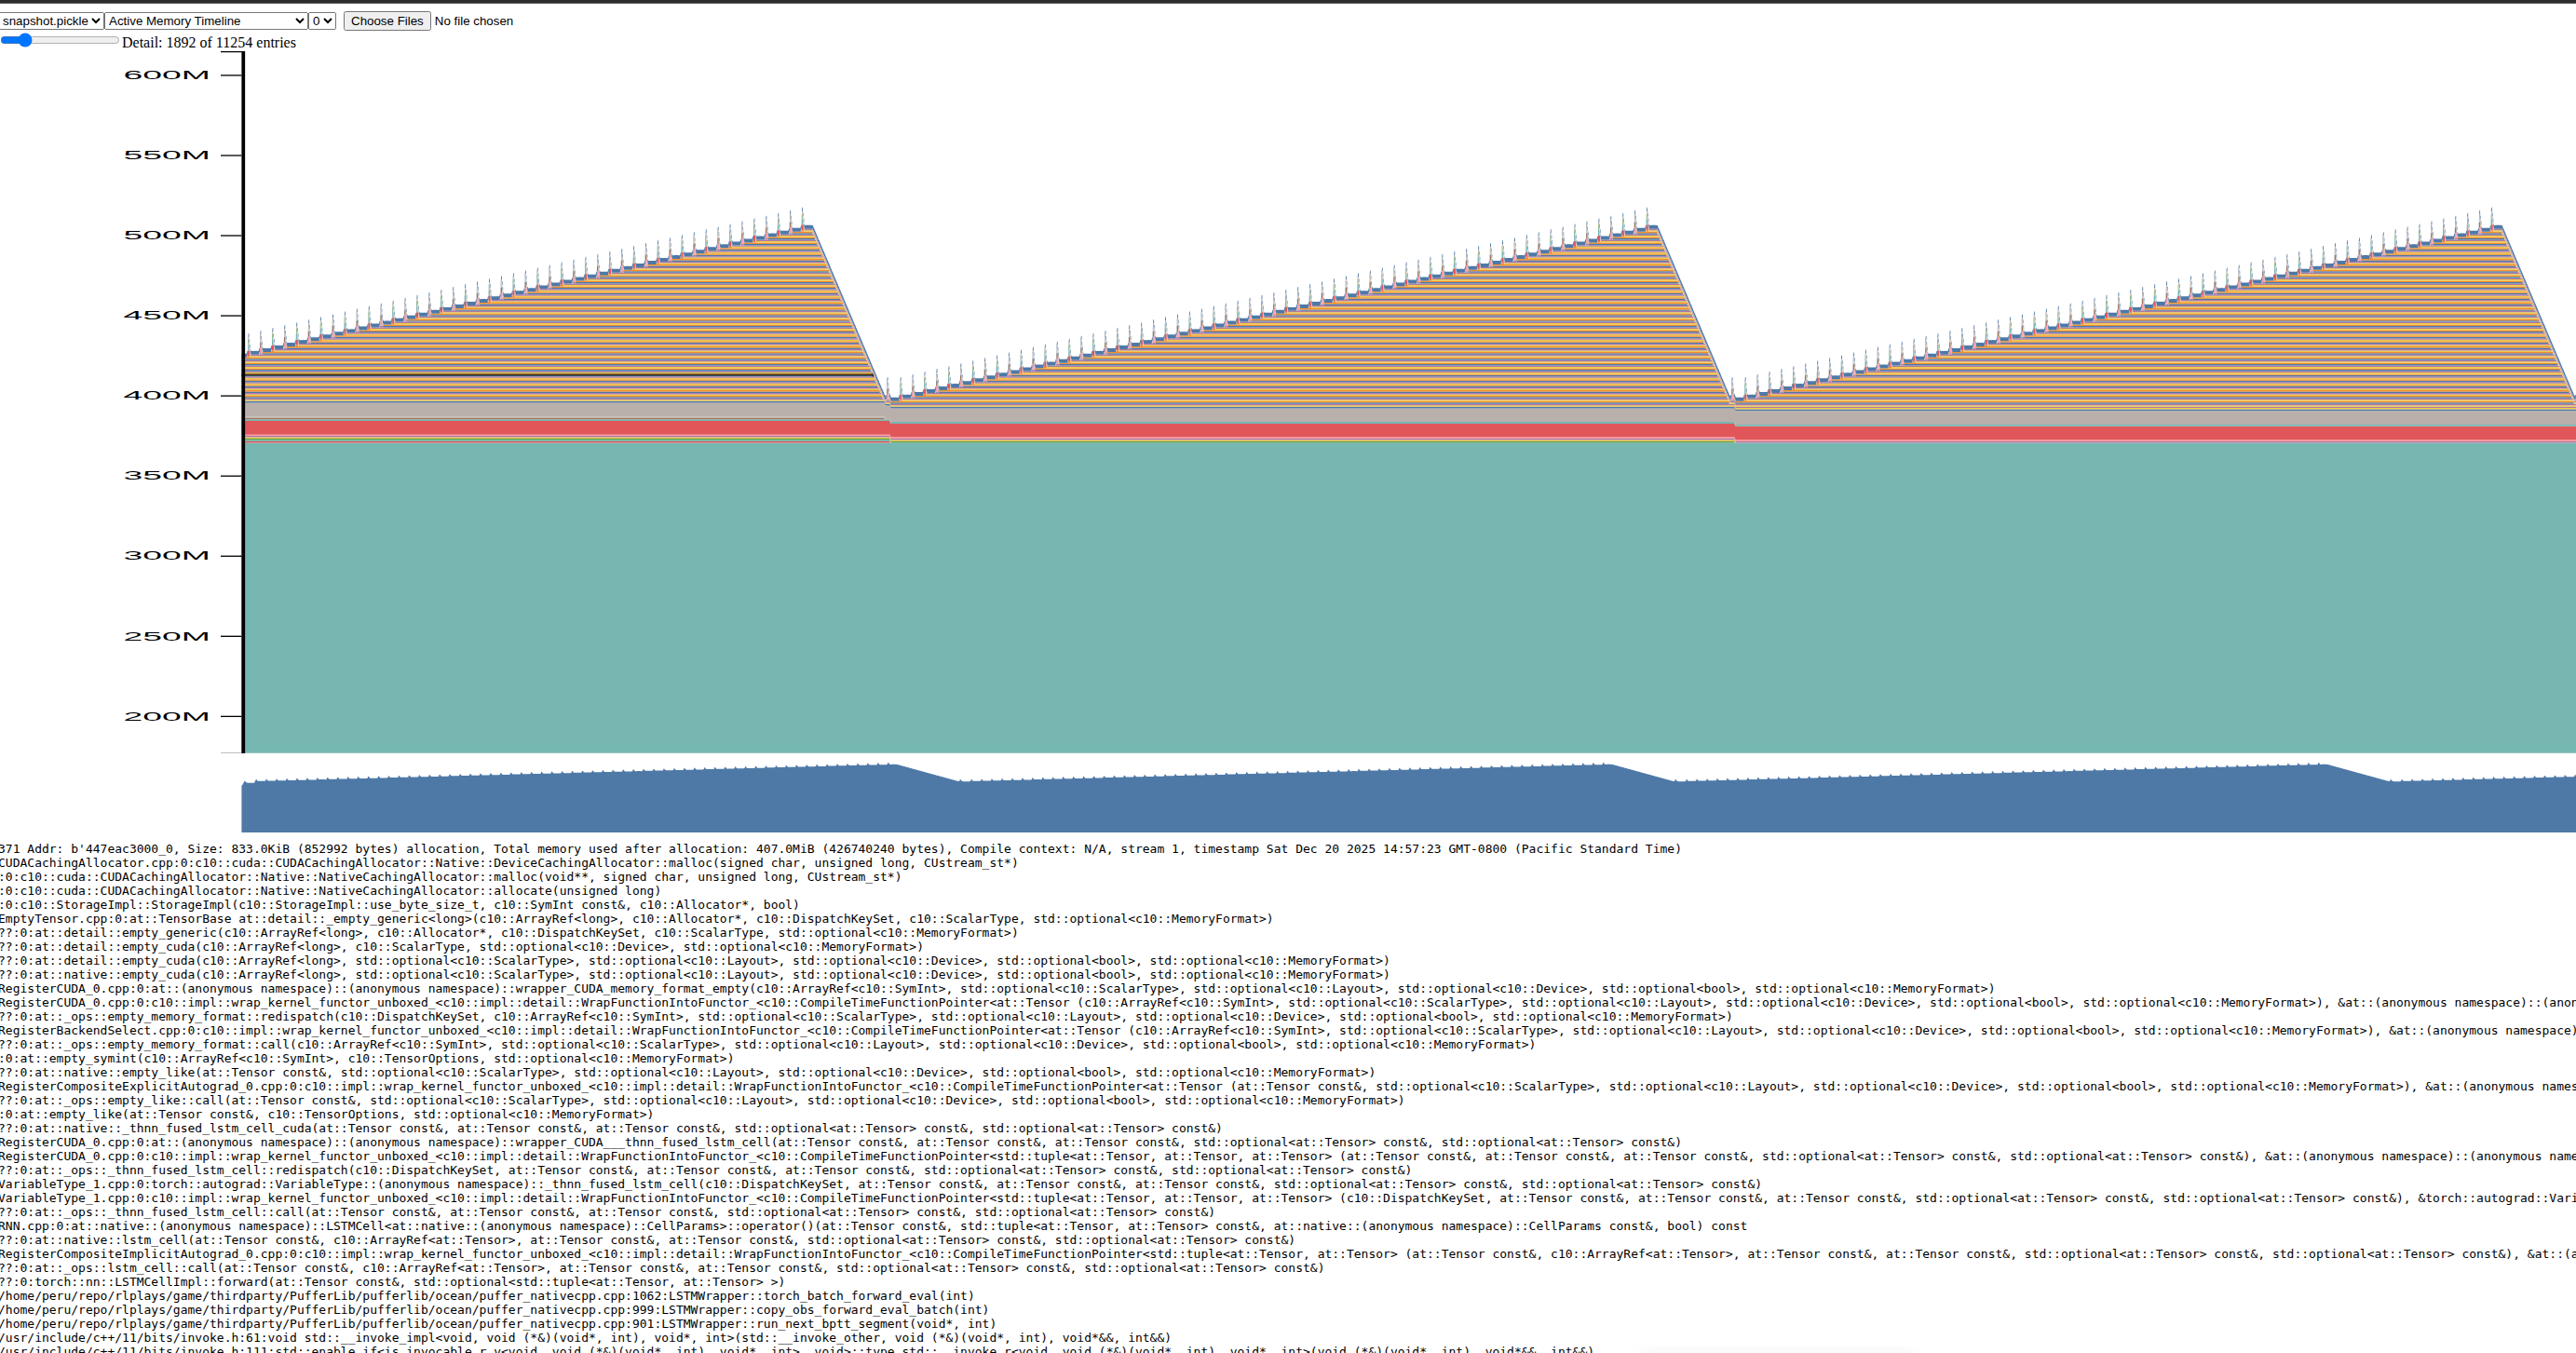
The saw-tooth shape means memory is not relinquished past a segment/batch (or even past several horizons). This is hugely problematic as PyTorch mistakenly keeps accumulating these Tensors (and for fat envs, it actually OOMs or worse, thrashes memory due to fragmentation). (Seeing a sawtooth shaped memory chart usually is a symptom of a memory leak, which is very well the behavior of the CUDA caching allocator here).
This problem is also present regardless of single/multi-threaded.
In order to avoid the CUDA caching allocator, we have to preallocate Tensors and pass them in. Preallocating Tensors is ‘easy’ because we know exactly the horizon length (# of segments), batch size, # of envs, neural network inputs/outputs/weights/biases ahead of time per horizon. However, passing them in to libtorch is not so easy. PyTorch/libtorch (rightfully) hide these internal functions because of (a) autograd (b) supporting multiple devices.
However, we don’t need autograd during evaluate and we are only targetting nvidia chips here.
Here is an example of how, say, self.encoder (a linear layer + GELU) is transformed:
  // This is in puffer_native.cpp
  at::_addmm_activation_out(state->hidden_transposed, encoder_bias, encoder_linear->weight,
    state->obs_device, 1, 1, /*use_gelu*/ true);
state->hidden_transposed is a preallocated tensor passed to this _out variant that is used by the self.encoder code above.
We have to convert the entire forward pass (encoder, decoder, LSTM cell plus sample_logits). I used custom CUDA kernels + _out to achieve that (see the other micro-optimizations below for details). Here is how the new memory profile looks:
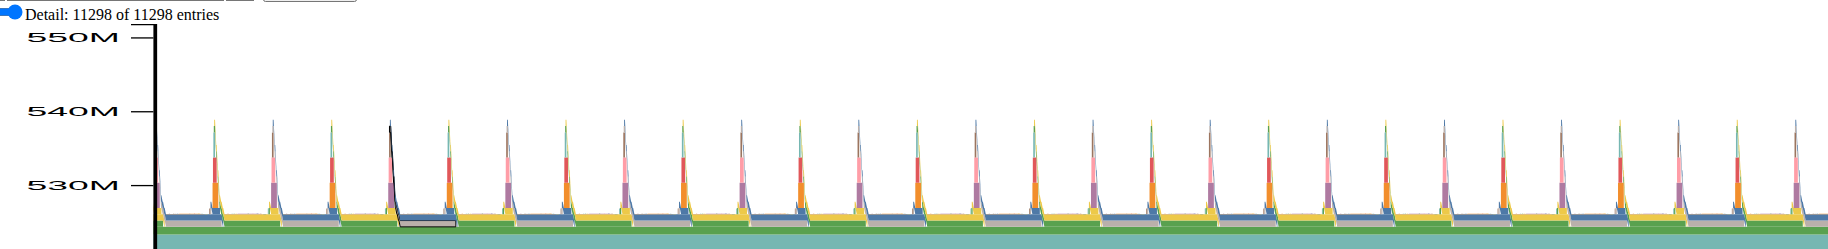
Note how the sawtooth shape is now flattened. However, the ‘base’ of the graph is higher because we have preallocated those tensors and cuda caching allocator is out of our way.
(I am showing an earlier version of the profile before I did more optimizations, so even the small intermediate allocs shown here are mostly gone).
This also nets us a nice benefit in terms of CPU cost (as we don’t invoke the cudaMemCpyAsync/cudaMemAlloc/cudaStreamSynchronize calls as well as the libtorch overhead). We are also ‘forced’ to fuse CUDA kernels which further reduces cudaLaunchKernerl overhead along with pure GPU ops cost (described in further sections).
Microbenchmarking tools/notes
I used several microbenchmarking tools.
- First: I added a simple C++
PerfTimerthat produces stats like this as part of the core loop (in CPU time):
encoder_forward  took 212130.936000ms    [ For 10000 iters; avg : 21.213094us; stddev : 3.923497us ]
encoder_addmm    took 184244.787000ms    [ For 10000 iters; avg : 18.424479us; stddev : 3.446059us ]

value_forward    took 72694.727000ms     [ For 10000 iters; avg : 7.269473us; stddev : 1.825029us ]
value_addmm      took 68694.117000ms     [ For 10000 iters; avg : 6.869412us; stddev : 291.338036ns ]
value_cudakrnl   took 77500.745000ms     [ For 10000 iters; avg : 7.750074us; stddev : 2.439263us ]
- I also used the libtorch/cuda profiler using
pufferl --profile/start_profile_envs.shscript that looks at the overall CPU/GPU (CUDA) times as well:
-------------------------------------------------------  ------------  ------------  ------------  ------------  ------------  ------------  ------------  ------------  ------------  ------------  ------------  ------------  ------------  ------------  --------------------------------------------
                                                   Name    Self CPU %      Self CPU   CPU total %     CPU total  CPU time avg     Self CUDA   Self CUDA %    CUDA total  CUDA time avg       CPU Mem  Self CPU Mem      CUDA Mem  Self CUDA Mem    # of Calls                                  Input Shapes
-------------------------------------------------------  ------------  ------------  ------------  ------------  ------------  ------------  ------------  ------------  ------------  ------------  ------------  ------------  ------------  ------------  --------------------------------------------
fused_lstm_cell_kernel(float const*, long, long, flo...         0.00%       0.000us         0.00%       0.000us       0.000us        2.887s        67.94%        2.887s       2.256ms           0 B           0 B           0 B           0 B          1280                                            []
                                        model_inference         0.00%       0.000us         0.00%       0.000us       0.000us        2.463s        57.95%        2.463s        2.463s           0 B           0 B           0 B           0 B             1                                            []
void at::native::elementwise_kernel<128, 2, at::nati...         0.00%       0.000us         0.00%       0.000us       0.000us     406.543ms         9.57%     406.543ms      63.522us           0 B           0 B           0 B           0 B          6400                                            []
dual_linear_forward_kernel(float const*, long, long,...         0.00%       0.000us         0.00%       0.000us       0.000us     294.467ms         6.93%     294.467ms     230.053us           0 B           0 B           0 B           0 B          1280                                            []
                         Memcpy HtoD (Pinned -> Device)         0.00%       0.000us         0.00%       0.000us       0.000us     224.239ms         5.28%     224.239ms      58.396us           0 B           0 B           0 B           0 B          3840                                            []
                                  volta_sgemm_32x128_tn         0.00%       0.000us         0.00%       0.000us       0.000us      56.357ms         1.33%      56.357ms      44.029us           0 B           0 B           0 B           0 B          1280                                            []
void at::native::reduce_kernel<512, 1, at::native::R...         0.00%       0.000us         0.00%       0.000us       0.000us      49.051ms         1.15%      49.051ms      38.321us           0 B           0 B           0 B           0 B          1280                                            []
- The profiling script also outputs the nice .json visualizable using ui.perfetto.dev to dig into different sections.
I used the internal LSTM impl + addmm_activation_out to replace the encoder/LSTM. However, the decoder and the sample logits present new opportunities to optimize even further.
This code is in puffer_native.cpp cuda_batch_forward_eval. I closely measured/analyzed/optimized using the micro-benchmark tools I mentioned above. After a round of optimization, I had tests that ensured the optimized outputs (closely) matched by comparing against old_lstm_network_forward_eval. Note e.g. the GELU approximation (tanh) / linear forward are closer to how the eval actually works after training than before - so there is some precision loss. But I ensured the final training perf/score (for the same number of steps/envs) is the same.
(Micro-)Optimization 4: Use fused CUDA kernels for sample_logits/decoder
The sample_logits and the decoder/value networks had a sprawling set of CUDA/pytorch ops before:
This uses a lot of PyTorch functions including multiple CUDA launch kernels/memcpys etc. Here is how the CUDA ops look like (~53 cuda launch kernels/cpy etc)
Before:
Analyzing the code/trace, I noticed the following:
-
Decoder / Value networks can be combined into a single kernel as they operate on the same input data (i.e.
hidden). I wrote adual_linear_forwardwith some Claude Opus 4.5 help initially to get started with CUDA kernels, however, the kernels are mostly hand-written.- This also preserves data locality as the input data is already likely in the cache.
-
sample_logitsdoes a lot of ops to produceactions,logprobs. I combined the two sets of ops into a single CUDA kernelsample_logits_kernel. I tried instantiating common templates for action counts 1-5 - but I think there are many other optimizations possible here (i.e. batch/grid/thread size) that I haven’t pursued yet as there were other Amdahl’s law optimizations that I pursued first.- I microbenchmarked various kernel sizes and settled on the current ones based on 2080 RTX.
-
As I mentioned above, the
encoder/lstmcell used a total of 4 ops - all internal libtorch/CUDA kernels.- I used double-buffering to preserve the
old H1/C1<->new H2/C2without any copies. It’s simply changing pointers to the lstm cell call.
- I used double-buffering to preserve the
So the total of 7 ops + 3 copies look something like this:
After:

| # CUDA memcpy+launches | Total time per-batch/segment | Batch size | |
| Before multiproc | ~53 | ~600 us | 4096 envs / batch 2 batches per seg |
| After native libtorch MT+ fused kernels | ~10 7 kernels / 3 copies | ~80 us | 1024 envs / batch 4 batches per seg |
Even with the increased number of batches, we still get a massive speedup - primarily because of (a) preallocating tensors (b) fused kernels (c) skipping libtorch layers via _out functions.
Other optimizations/notes:
-
I moved most of the preallocations to a one-time setup cost (as opposed to per-horizon).
- Pro: Almost zero cuda mallocs during a horizon run. Only assign the trained nn weights/biases alone per horizon.
- Con: Memory is limited for training (buy better GPU / throw money at the problem?)
-
I tried to reuse the multithreading as much as possible. e.g. the per-horizon setup initializes batches multi-threaded which minimizes on
zero_/copy_/random_calls as the number of horizon segments (64) x batches (8) is large enough where smallnsadd up to a sizeableus. -
sample_logitswas callinguniform_unnecessarily (especially from CUDA land). I used an old GPGPU trick to pass a per-segment/batch pre-random_’ed Tensor to sample themultinomialfrom within the kernel. -
I moved some of the CUDA ops to the CPU itself: for e.g. clamping the rewards to
[-1, 1]and converting the terminals frombooltofloat.- Because the env
stepjust produced that data, it’s likely in the (L1?) CPU cache and it’s already multi-threaded, so it savescuda launch kernelcost + GPU ops from doing these tiny calcs and instead just do them right when we run the env in the CPU.
- Because the env
-
Calculating the GPU batch size and env size:
- GPU/PCIe bandwidth is roughly 6GB/s (2080 RTX), 16GB/s (4090 RTX) etc.
- For simple envs such as breakout, with 118 floats per step, 64 steps in an horizon, 8192 envs per horizon we are transfering ~2MB per epoch.
- Using the script
scripts/test_cuda_perf.pywe can check-out the actual transfer rates for various batch sizes. - So using the PCI transfer and the env size for a given GPU, we can estimate batch size.
- 8 batches seems to be a good number for the envs I tested with. With ‘fat’ envs with a very large obs size + network size, it’s better to use more batches; for thin envs, smaller batch size suffices (~4).
- This could be handled by
sweeping: too few batches will mean GPU compute is starved. Too many batches might mean we spend time launching kernels/copies and coordinating threads instead. It’s a balance just like any hyperparam sweep.
-
Minor things:
- Printing the dashboard takes
~18ms-30ms(depending on the machine) per printout (!) At the scale we are operating where everymscounts, this actually shows up (about 4 times a second,~72-120msper second!)- TODO: If eval+train is fully in C++, this probably doesn’t matter ? Otherwise move this to a separate Python process ?
- Printing the dashboard takes
Tried/Failed: CUDA graphs
- CUDA graphs theoretically help eliminate multiple
launch kernelcosts. - However, for our needs, CUDA graphs need extra work to make them work that beat their purpose for this particular use-case:
- If you have lots of kernel launches + allocs, the CUDA graph can record the memcpy/launch etc using fixed tensors that libtorch+CUDA work together.
- However, each segment will change the tensor address and hence requires a copy.
- Further, we have very few kernels anyway and just a few copies already, so adding extra copies with cuda graph overhead didn’t justify the cost (in fact, based on my experimentation it was way slower in runtime perf when I added cuda graphs to the multithreaded GPU batching with fused kernels / prealloced tensors)
Links/Data
Code: https://github.com/rlplays/pufferlib ->> This will end up in Puffer 4.0, so recommend waiting it out!
I used very little LLMs to do most of this work as this is outside their training dataset. I use LLMs mainly as an autocomplete++ and to understand/decipher code (like Torch or CUDA). I typically do not generate more than a line or two of code. I do use LLMs more extensively for scripts and UI code.
Some more data on just the 2080RTX card:
| Game/Env | 2080 RTX | ||
|---|---|---|---|
| MultiProc | NativeMT | Notes | |
| g2048 | 2M SPS | 1M SPS | Much slower because uint8_t obs vs float32 obs / 4x bandwidth (haven’t supported uint8 yet) |
| pacman | 1.5M SPS | 2.9M SPS | |
| rlplays | 25K SPS | 130K SPS | Large GPU batch + ‘fat’ env (will open-source once cleaned up) |